Twitter Popularity Analysis
This is a group project I led involving a Python based data analysis report, using the libraries Pandas and Scikit-Learn. The report analyses the popularity (number of followers) of a user in contrast to features such as user interactivity, coherence and other language features from a derived dataset of roughly 5000 twitter users. Techniques employed include Pearson Correlation, Mutual Information and Regression Analysis.
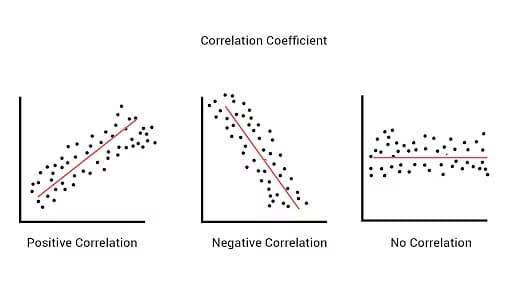
For those unfamiliar, Pearson Correlation provides a measure of how close a set of datapoints on a scatter plot is to a straight line, therefore identifying the strength of the linear relationship between two variables. It provides a value between -1 and 1 - where -1 represents a perfectly negative linear relationship, 1 represents a perfectly linear relationship.
Mutual information on the other hand measures the amount of information about X we gain by knowing Y, or more accurately, the reduction in uncertainty about variable X if Y is known. The number it provides is any number above zero, and usually needs to be considered relatively. The usefulness comes in the fact that it will identify any kind of relationship, not just linear.
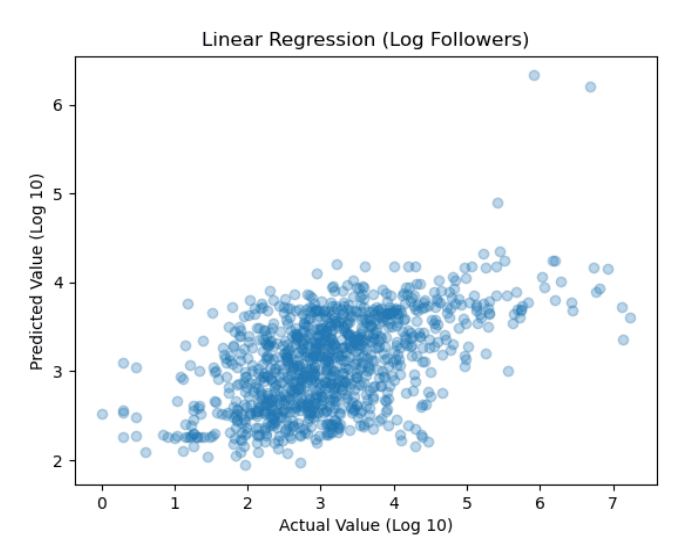
Finally, regression analysis involves creating a linear (or multilinear) model - that is, a model that assumes a linear relationship between the input variables (X1, X2, ..., Xn) and the single continuous output variable (y). More specifically, we create model which assumes y can be calculated from a linear combination of the input variables (X). The analysis then revolves around the accuracy of this model, i.e. how well the input factors predict the output factor via linear relationships.
To do this, an abstract data processing pipeline was programmed in such a way that enables anyone to choose which section of a given dataset to analyse - using the described techniques. While it was not done so (as this project is in the context of an assignment), this pipeline can be readily modified to be used on any csv file where one wishes to analyse a given column against other data in the set using Pearson Correlation, Mutual Information and Regression Analysis. While understood, the pipeline makes use of the mentioned Python libraries to actually do the appropriate data manipulations and analyses.
Code aside, the report includes some interesting findings, the most noteworthy being that years on the app has by far the strongest correlation to followers. Also, surprisingly, fields such as total tweets and hashtags per tweet were negatively correlated to followers (although admittedly, a weak correlation, but nonetheless shocking it could be negative at all). Another quite comical outcome was that all measures of 'coherence' (lexicographical coherence and topic coherence - derived from the original dataset referenced in the report) exclusively bore a negative correlation with a user's number of followers. Again, these were weak correlations, but hilarious it would be negative at all. Samples of just the correlation matrices are below.


The report, as well as the abstract pipeline which generates the data used in the report, can be found here at https://github.com/ethanhusband/follower-analysis.git